范文阅读导入练习 →

美国家庭年收入分布Number of households in the US by their annual income

Task 1 · Academic数据时序变化概括工作与经济225 词AI 估评 7.5 分
AI 估评 7.5 分查看四维评分详情

四个维度等权计分,均值 7.5,按半分档展示。AI 估评供学习参考。

任务完成度 TA8 / 9

概述稳定中间组和最高组增长,所有类别趋势均覆盖,最高组先降后升也明确;若干估值约少100万但在近似表述内,最少组排名可更突出。

档位依据:主要特征充分且基本准确,达到8档;提高近似数值与排名概括可更完整达到9档。

查看评分证据
  • relative stability across the middle-income groups

    正确概括两个中间收入组。

  • dropped slightly in 2011 but then surged to nearly 34 million by 2015

    最高组转折与末年峰值准确。

  • 题图证据

    已看五组柱图,2007/2011/2015近似百万户:低于2.5万25/29/28,2.5—4.9999万27/30/29,5—7.4999万21/21/21,7.5—9.9999万14.5/14/15,10万及以上29.5/28/33.5;读数按刻度估计。

改进建议

  • 将低收入两组2015估值更贴近2800万和2900万,并指出7.5—9.9999万组始终最少。

连贯与衔接 CC7 / 9

按低中收入与最高收入分组,走势容易跟随;最高收入段先重复笼统增长再描述下降反弹,结尾和概述重复较多。

档位依据:清楚组织和推进达到7档;冗余表达限制8档紧凑衔接。

查看评分证据
  • The $25,000–$49,999 group followed a similar pattern

    用相同趋势联系相邻收入组。

  • noticeably grew with an upward trajectory

    与后一句具体起伏相比信息重复。

改进建议

  • 删除最高收入段首句的重复趋势评价,直接从首年到2015展开。

词汇资源 LR7 / 9

income brackets、retreating、hovering、surged词汇丰富;with over a hundred thousand yearly earnings搭配不自然,grew with an upward trajectory冗余。

档位依据:有范围但存在个别搭配问题,符合7档而非8档。

查看评分证据
  • hovering at around 15 million households

    描述小幅变化自然。

  • households with over a hundred thousand yearly earnings

    应写households earning at least $100,000 annually,并保留含边界的at least。

改进建议

  • 用at least $100,000 in annual income,避免冗长重述。

语法范围与准确性 GRA8 / 9

while/whereas对照、before分词、关系从句和并列结构准确,多数句无错,数量修饰清楚。

档位依据:结构范围与准确性符合8档;少量复杂名词组合稍拗口,未达9档全面自然。

查看评分证据
  • grew to around 28 million in 2011 before retreating slightly

    主句与before分词结构准确。

  • which was the highest figure among all income groups

    关系从句补充末年比较清晰。

改进建议

  • 将冗长收入名词组改成earning分词修饰,保持其余句式。

评分日期:2026-10-23 · 评分规则:IELTS 写作公开评分标准(2023 年 5 月版)

作文题目

来源页题目,与同页选定答案配套;未核为实际考试真题
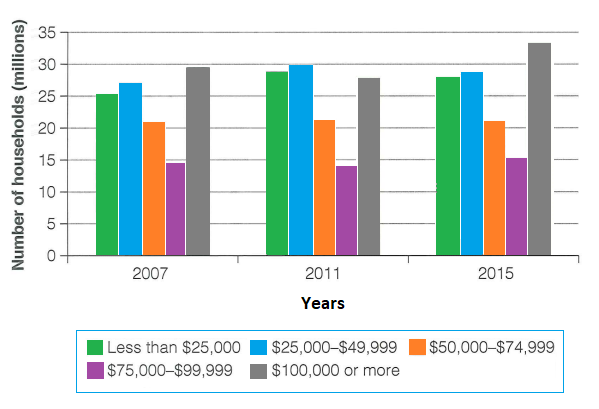
The chart below shows the number of households in the US by their annual income in 2007, 2011, and 2015. Summarise the information by selecting and reporting the main features, and make comparisons where relevant. Write at least 150 words. Number of US households (in millions), by annual income
题目配图:IELTS Graph # 331 – Number of households in the US by their annual income
来源题图 · 查看来源
The column chart portrays the number of U.S. households in five income brackets for the years 2007, 2011, and 2015. The income categories range from “less than $25,000” up to “$100,000 or more”. In general, while there was relative stability across the middle-income groups in the USA, households earning $100,000 or more increased significantly over the period, whereas those in the lowest bracket rose moderately and then declined slightly. In 2007, approximately 25 million households had an annual income of less than $25,000. The number of such families grew to around 28 million in 2011 before retreating slightly to about 27 million by 2015. The $25,000–$49,999 group followed a similar pattern, peaking at 30 million in 2011 and falling back to roughly 28 million in 2015. Meanwhile, the number of households earning $50,000–$74,999 remained remarkably stable at around 21 million throughout the entire period, and the $75,000–$99,999 bracket saw only minor fluctuation, hovering at around 15 million households. In contrast, the number of US households with over a hundred thousand yearly earnings noticeably grew with an upward trajectory. From under 30 million in 2007, the number of such households dropped slightly in 2011 but then surged to nearly 34 million by 2015, which was the highest figure among all income groups.
文章身份
机构教研范文
题目来源
教学题目
句子漫游 · 我的账户

欢迎回来

注册后可主动领取 3–7 天新手券。

选择适合你的练习节奏

练习时长

AI 学习需有可用练习时长。