
共享单车行程与使用目的Bike-share trips and purposes
AI 估评 9 分查看四维评分详情
四个维度等权计分,均值 8.75,按半分档展示。AI 估评供学习参考。
任务完成度 TA9 / 9
两图均充分概括,五倍总体增长与2020后加速准确,列出转折点并将通勤比例换算日均6900次,信息整合恰当。
档位依据:所有关键特征及支持细节准确,达到9档。
查看评分证据
bike-share use grew fivefold over the period, with most of the growth coming after 2020
正确概括长期增长及主要发生阶段。
which equals roughly 6,900 of the 15,000 daily trips
把两图同年数据准确结合。
- 题图证据
已看折线与饼图:日均千次2016=3、2018=5、2020=4、2022=9、2024=15;2024通勤46%、购物杂事21%、休闲18%、接驳公交火车15%。
改进建议
- 保持趋势、构成和跨图换算的平衡。
连贯与衔接 CC9 / 9
引言、共同概述、时间趋势和用途结构安排清楚;衔接与指代自然,末项用remaining收束,阅读不费力。
档位依据:篇章组织与段内推进均自然,达到9档。
查看评分证据
This figure rose to 5,000 in 2018 and dipped slightly to 4,000 in 2020
同一指代串联上升和转折。
Shopping and errands came second at 21%, followed closely by leisure at 18%.
由排名第二自然推进至第三。
改进建议
- 保持按图分段且在需要时整合数据的方式。
词汇资源 LR8 / 9
fivefold、dipped、climbing sharply、accounting for与errands表达准确,变化和占比词汇丰富,少量末句措辞稍口语。
档位依据:灵活流畅的8档成立;took riders to a bus or train略欠精确,限制9档。
查看评分证据
accounting for almost half of all trips
概括46%的搭配自然。
The remaining 15% of trips took riders to a bus or train.
可以更精准说明公共交通接驳目的。
改进建议
- 末句可写connected riders with bus or train services。
语法范围与准确性 GRA9 / 9
while对照、with结构、分词、关系从句和before结构控制准确,长句清晰,数字并列和时态无误。
档位依据:结构多样且持续准确,达到9档。
查看评分证据
before climbing sharply to 9,000 in 2022 and 15,000 in 2024
时间关系及并列终点表达准确。
46% of trips in 2024 were made by people commuting to work or study
被动与分词修饰自然。
改进建议
- 维持这种将语法变化用于呈现数据关系的写法。
评分日期:2026-10-23 · 评分规则:IELTS 写作公开评分标准(2023 年 5 月版)
作文题目
GoPrep Writing course 原创练习数据与题目;网站说明为教学材料,非官方IELTS试题。
The line graph below shows the average number of bike-share trips made per day in one city between 2016 and 2024. The pie chart shows the purposes of these trips in 2024. Summarise the information by selecting and reporting the main features, and make comparisons where relevant.
Year | Trips per day | Change since the previous year shown
2016 | 3,000 | Starting point
2018 | 5,000 | Up 2,000
2020 | 4,000 | Down 1,000
2022 | 9,000 | Up 5,000
2024 | 15,000 | Up 6,000
Purpose | Share of trips | Rank
Commuting to work or study | 46% | 1st
Shopping and errands | 21% | 2nd
Leisure | 18% | 3rd
Getting to a bus or train | 15% | 4th
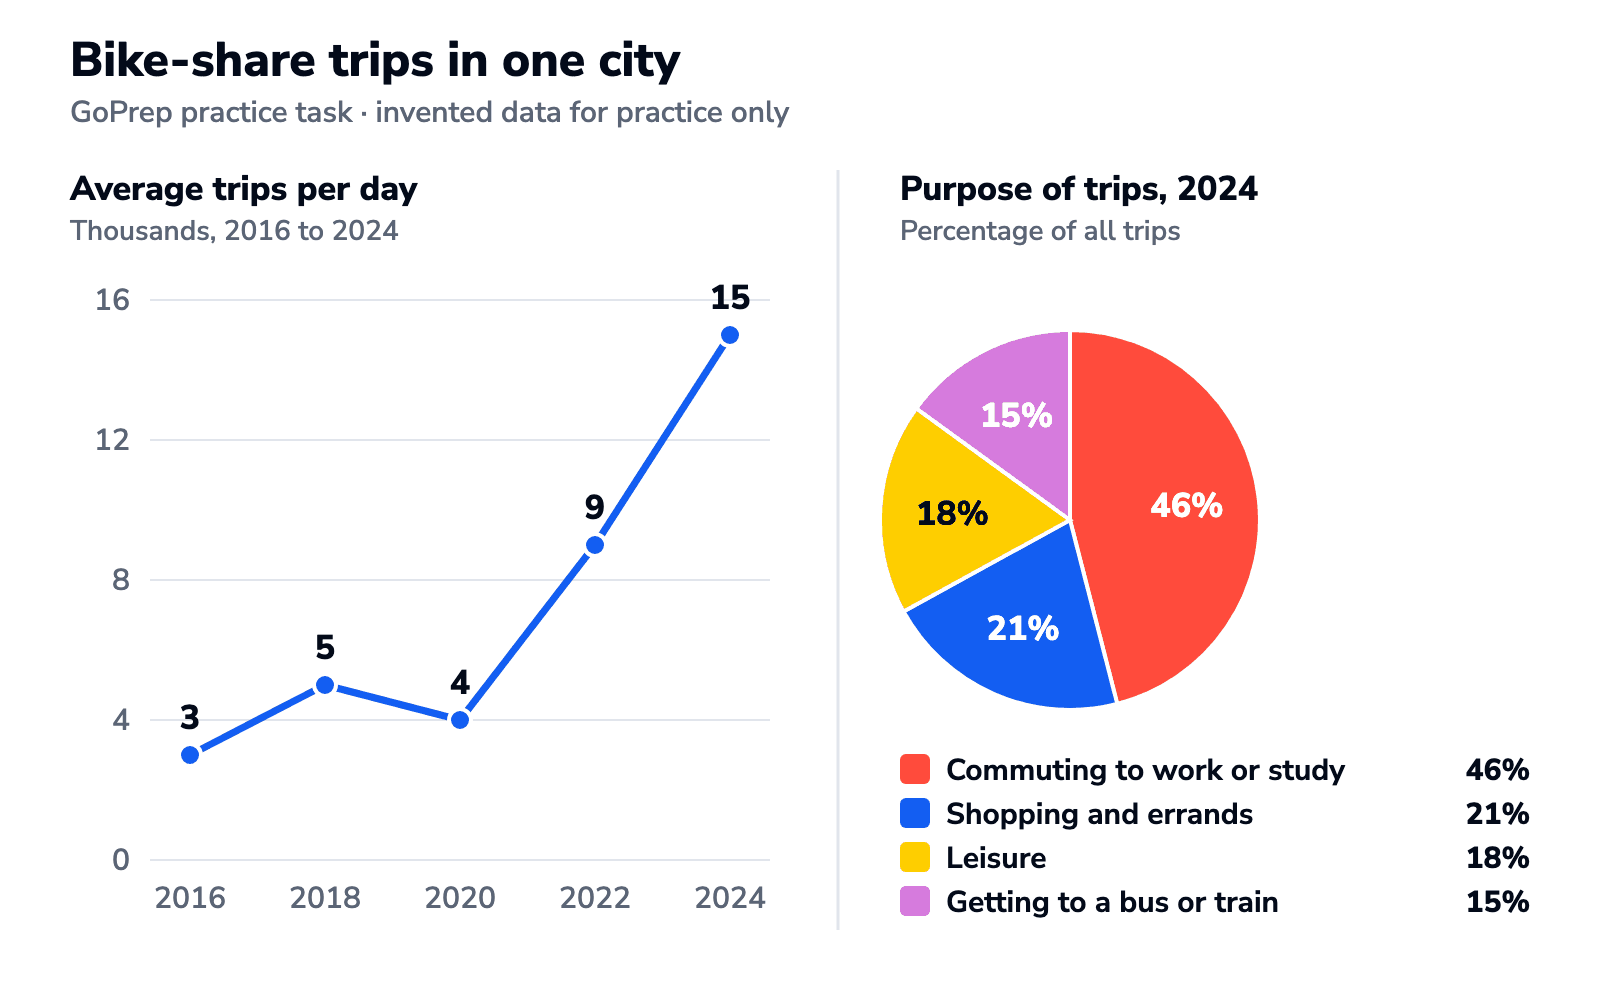
The line graph shows the average number of bike-share trips made per day in one city between 2016 and 2024, while the pie chart shows what these trips were used for in 2024.
Overall, bike-share use grew fivefold over the period, with most of the growth coming after 2020. In 2024, commuting was by far the most common purpose, accounting for almost half of all trips.
In 2016, riders made an average of 3,000 trips a day. This figure rose to 5,000 in 2018 and dipped slightly to 4,000 in 2020, before climbing sharply to 9,000 in 2022 and 15,000 in 2024. In other words, the number of daily trips increased almost fourfold in the last four years alone.
Turning to the purposes of these journeys, 46% of trips in 2024 were made by people commuting to work or study, which equals roughly 6,900 of the 15,000 daily trips. Shopping and errands came second at 21%, followed closely by leisure at 18%. The remaining 15% of trips took riders to a bus or train.
- 文章身份
- 机构教研范文
- 题目来源
- 原创教学练习题