
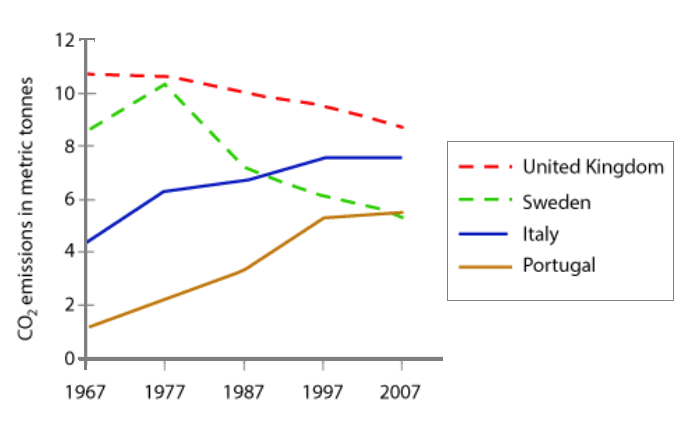
英瑞意葡的人均二氧化碳排放Carbon dioxide emissions per person in the UK, Sweden, Italy and Portugal
AI 估评 8 分查看四维评分详情
四个维度等权计分,均值 7.75,按半分档展示。AI 估评供学习参考。
任务完成度 TA7 / 9
任务完成度(Task Achievement,TA,即是否准确选取并概括图表特征):涵盖四国、时期、人均单位,概述明确英国始终最高而意葡上升,细节也补充瑞典先升后降。各国起止值基本合理。对意大利全程稳步增长的概括忽略1997至2007年的持平,未突出意大利超越瑞典及瑞葡末期接近,瑞典峰值与年份也略粗略。
档位依据:达到7档所需的清楚概述、主要趋势和有数据支持的分类;离8档的充分、娴熟呈现仍有距离,尤其转折、交叉和末期收敛的比较欠充分,个别时间与趋势概括不够精细。
查看评分证据
In general, the UK consistently accounted for the highest CO 2 emissions per capita, although its figures declined steadily. In contrast, Italy and Portugal started with relatively low levels of average CO 2 emissions, but witnessed clear upward trends.
概述清楚抓住英国最高及意葡上升两组主要特征。
Italy’s per-person emissions increased steadily from about 4 tonnes in 1967 to almost 8 tonnes by 2007.
起止值大体合理,但steadily覆盖整个时期,未反映1997年后的平台。
climbed to a peak of nearly 11 tonnes in the mid-1970s
图中瑞典最高观测点在1977年、略高于10吨,此处时间和数值偏粗。
- 题图证据
图上英国红线始终最高,约10.7吨降至8.7吨;瑞典绿线1977年约10.2吨达到峰值,之后降至约5.3吨;意大利蓝线约4.2升至7.5吨,1997至2007年水平;葡萄牙橙线约1升至5.5吨,最终与瑞典很接近。
改进建议
- 明确意大利1997年后稳定在约7.5吨,瑞典峰值发生于1977年且略高于10吨。
- 加入意大利在1987至1997年之间超过瑞典、瑞葡2007年接近的主要比较。
连贯与衔接 CC8 / 9
连贯与衔接(Coherence and Cohesion,CC,即信息顺序和连接是否易于理解):四段各有明确作用,英国和瑞典的下降走向、意大利和葡萄牙的上升走向分别展开,便于比较。This figure、After that以及although等衔接清楚,时间顺序稳定,阅读流畅。
档位依据:符合8档逻辑排序、衔接管理良好且段落使用充分恰当;9档要求衔接几乎不引人注意,本文几处显式转折与逐国推进仍较常规,尚未显示同等娴熟程度。
查看评分证据
This figure fell gradually throughout the period, reaching roughly 9 tonnes by 2007. Sweden followed a different trajectory:
This figure准确承接英国起点,随后显式转入瑞典的不同轨迹。
After that, the number dropped sharply, falling to just over 5 tonnes by the end of the period.
时间指示自然承接瑞典峰值,终点与起点的关系清楚。
Italy and Portugal, on he other hand, showed broadly similar trends, although the scale differed.
下一段先建立两国共同走向和规模差异,再给各国数据;拼写笔误不影响段落关系。
改进建议
- 在上升组中直接衔接两国增长幅度或终点差距,使比较更紧凑。
- 用图上交叉和末期接近关系承接不同国家,进一步减少逐国报告感。
词汇资源 LR8 / 9
词汇资源(Lexical Resource,LR,即表达范围和用词精度):per capita、trajectory、climbed to a peak、broadly similar和the scale differed等词组自然支持趋势、数量和对照,变化充分。少数细节欠精准,如用number代指排放量;on he other hand有一个明显拼写遗漏,但不影响理解。
档位依据:词汇范围广、使用流畅灵活,偶发不准确和拼写错误影响很小,符合8档;未达9档几乎全篇精确自然的控制,主要差在个别指量词和固定词组的准确性。
查看评分证据
Sweden followed a different trajectory: its per capita CO 2 release began at about 9 tonnes and climbed to a peak of nearly 11 tonnes in the mid-1970s.
trajectory、per capita与climbed to a peak提供自然且多样的图表表达;数据粗略的问题归入任务维度。
on he other hand
固定词组漏写the中的t,属于局部拼写问题。
After that, the number dropped sharply
number用于连续的排放量不如figure或emissions精确,但表达仍清楚。
改进建议
- 校对固定词组on the other hand。
- 用emissions或the figure指代排放量,并在必要处区分绝对增量和增长倍数。
语法范围与准确性 GRA8 / 9
语法范围与准确性(Grammatical Range and Accuracy,GRA,即句式变化及语法控制):有让步从句、非限制性定语从句、分词结构、插入说明及冒号解释,均能服务信息传达。绝大多数句子语法准确,时态和标点稳定,较长句也保持清晰。
档位依据:满足8档句式范围宽、使用灵活准确且大多数句子无误;9档还要求任务范围内更充分的灵活控制,本文多次沿用主句加分词终点说明,整体证据更稳妥地支持8档。
查看评分证据
In 1967, an average person in the UK emitted around 11 tonnes of CO 2 , which was far higher than the figures in other countries.
时间状语、非限制性定语从句及比较结构结合,主从关系清楚。
Portugal, which started at only around 1 tonne per person, experienced the fastest growth, reaching approximately 5 tonnes of CO 2 emissions per person by 2007.
插入关系从句与结果分词结构准确,长句控制良好。
Italy and Portugal, on he other hand, showed broadly similar trends, although the scale differed.
让步结构准确,局部he是拼写问题而非句法失控。
改进建议
- 保持现有准确性,可用带时间边界的复合句区分增长阶段与平台阶段,增强结构与数据变化的对应。
评分日期:2026-10-23 · 评分规则:IELTS 写作公开评分标准(2023 年 5 月版)
作文题目
来源页题目,与同页选定答案配套;未核为实际考试真题
- 文章身份
- 机构教研范文
- 题目来源
- 教学题目