
电影院图书馆与游泳池客流Visits to a cinema, library and swimming pool
作文题目
发布方明确说明为该站原创教学题目,未取自实考题/官方练习题。
The task. The graph below shows the number of visits to three kinds of venue in one city between 2000 and 2024. Summarise the information by selecting and reporting the main features, and make comparisons where relevant. Write at least 150 words.
Year | Cinema | Library | Swimming pool
2000 | 410 | 380 | 210
2006 | 470 | 330 | 235
2012 | 520 | 260 | 240
2018 | 610 | 190 | 290
2024 | 545 | 165 | 355
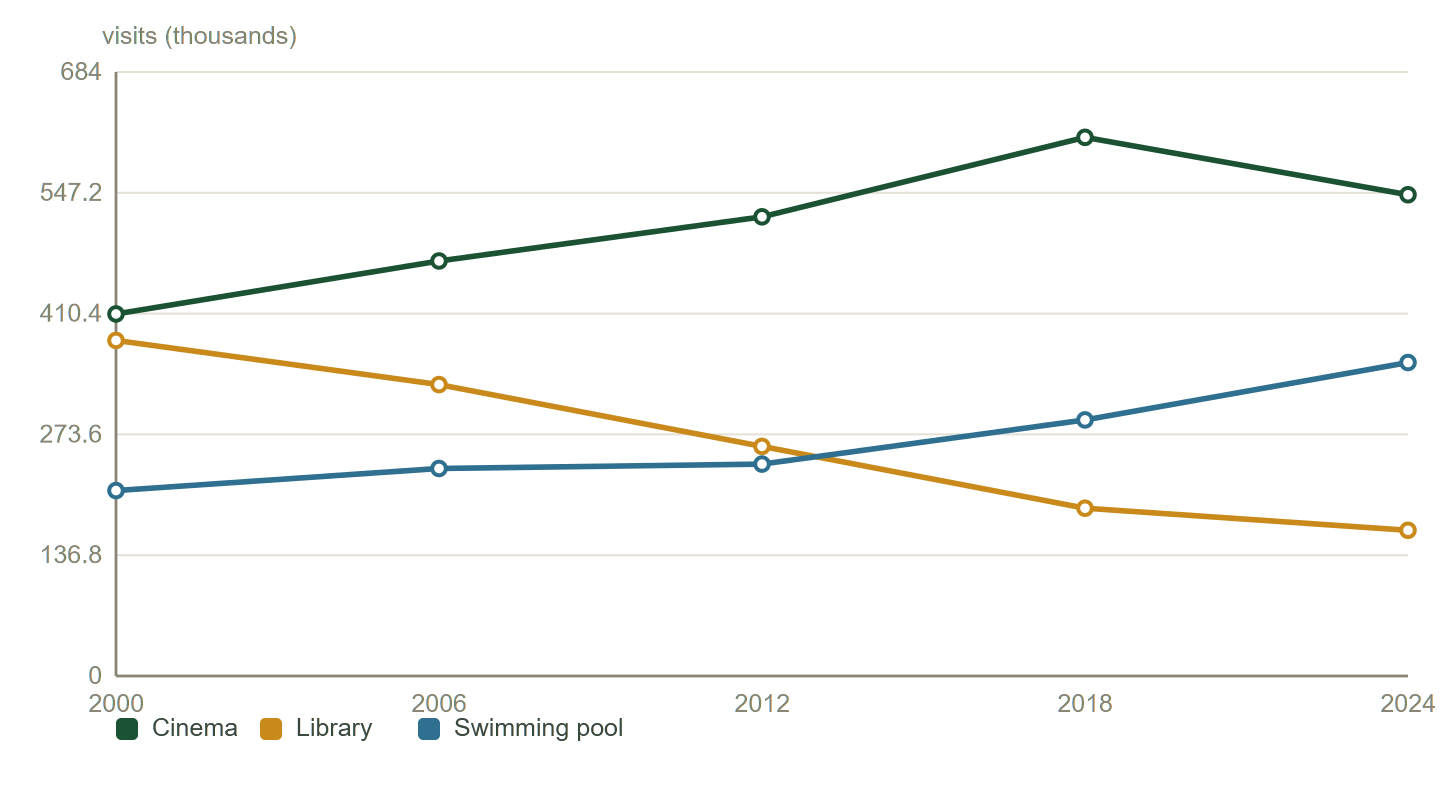
The graph compares how often people visited a cinema, a public library and a swimming pool in one city over a twenty-four-year period, with all figures given in thousands of visits.
Overall, the cinema was the most popular of the three venues in every year shown, while library use declined without interruption throughout. The most striking change is the reversal between the library and the swimming pool, which had exchanged positions by the end of the period.
Cinema visits climbed steadily from 410,000 in 2000 to a peak of 610,000 in 2018, an increase of roughly half, before falling back to 545,000 in 2024. The swimming pool followed a gentler but uninterrupted upward path, rising from 210,000 to 355,000, with the sharpest growth occurring after 2018.
Library visits, by contrast, fell in every period measured. Having stood at 380,000 in 2000 — only slightly below the cinema figure — they had more than halved by 2018 and reached 165,000 in 2024. The pool overtook the library at some point between 2012 and 2018, and by the end of the period was attracting more than twice as many visits.
- 文章身份
- 机构教研范文
- 题目来源
- 原创教学练习题