范文阅读导入练习 →

自有住房与租赁住房的家庭比例Percentage of households in owned and rented accommodation

Task 1 · Academic数据时序变化概括健康与生活239 词AI 估评 7.5 分
AI 估评 7.5 分查看四维评分详情

四个维度等权计分,均值 7.5,按半分档展示。AI 估评供学习参考。

任务完成度 TA7 / 9

长期逆转、1971相等及最后十年回落覆盖充分;地区误写UK and Wales,段落时间范围说1961至1991却继续给2001,住房份额也不能直接代表偏好。

档位依据:关键趋势与数值支持7档;地区及阶段界定错误使其未达8档。

查看评分证据
  • households in the UK and Wales

    题目是England and Wales,不能扩大至英国。

  • The most dramatic change occurred between 1961 and 1991. During this period, home ownership increased sharply, rising from around 40% in 1961 to a peak of approximately 70% in 2001.

    所定义时期与后面终年矛盾。

  • 题图证据

    已查看柱图,自有/租房约值1918为22/78,1939与1953为32/68,1961为42/58,1971为50/50,1981为60/40,1991为68/32,2001为69/31,2011为65/35。

改进建议

  • 纠正地理范围,统一1961至2001阶段,并以居住比例替代偏好判断。

连贯与衔接 CC7 / 9

早期、转变、最终回落的分段清楚;中段先到2001再退回1971且During this period范围不一致,局部推进受损。

档位依据:整体清楚达到7档;时间回跳与指示语失准限制8档。

查看评分证据
  • During the same period, renting fell to just about 30%

    same period因前述1991与2001冲突而含混。

  • The year 1971 was a key turning point

    在2001之后补早期转折,顺序稍回跳。

改进建议

  • 先写1971相等,再写2001峰值,最后写2011回落。

词汇资源 LR8 / 9

corresponding decline、edged upward、complete reversal等范围宽且自然;preferred option把实际住房情况误作意愿。

档位依据:词汇流畅性达到8档;少量语义过度解释限制9档。

查看评分证据
  • accompanied by a corresponding decline in renting

    两系列互补关系表达自然。

  • the overwhelmingly preferred option

    占比不等于偏好,可用the more common tenure。

改进建议

  • 用more common arrangement或tenure准确表达居住类型。

语法范围与准确性 GRA8 / 9

被动、关系、让步及分词结构准确,复杂句控制稳定,多数句无误。

档位依据:广泛准确句式符合8档;长中段多层时间修饰可精炼,尚非9档。

查看评分证据
  • Although ownership remained dominant into the 21st century, the final decade saw a slight decline.

    让步结构准确。

  • as the proportion of owners and renters became equal for the first time

    从句和主谓一致正确。

改进建议

  • 缩短多时间点长句,明确每个比较的起止年份。

评分日期:2026-10-23 · 评分规则:IELTS 写作公开评分标准(2023 年 5 月版)

作文题目

来源页题目,与同页选定答案配套;未核为实际考试真题
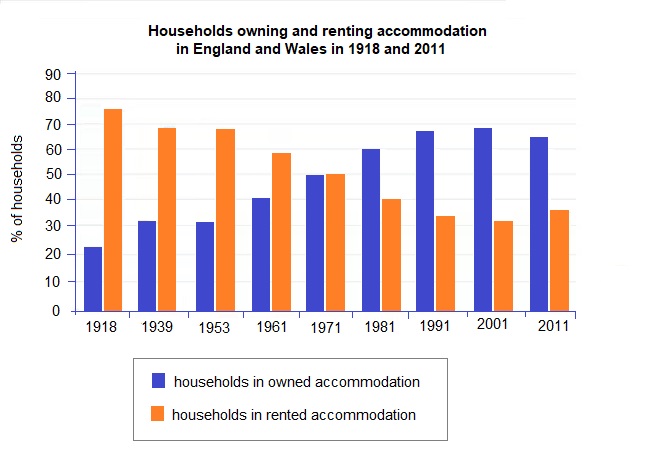
The chart below shows the percentage of households in owned and rented accommodation in England and Wales between 1918 and 2011. Summarise the information by selecting and reporting the main features, and make comparisons where relevant. Write at least 150 words.
题目配图:IELTS Graph # 351 – Percentage of households in owned and rented accommodation
来源题图 · 查看来源
The bar chart compares the proportion of households living in owned and rented accommodation in England and Wales from 1918 to 2011. Overall, the long-term trend shows a steady rise in home ownership, accompanied by a corresponding decline in renting. By the end of the period, owning a home had become the more common arrangement, whereas renting dominated the early decades. In 1918, almost 80% of households in the UK and Wales lived in rented accommodation, making it the overwhelmingly preferred option at that time. Home ownership was comparatively rare, with just over 20% of households owning their homes. Over the following decades, however, this pattern began to shift. By 1939 and 1953, rented housing still accounted for roughly two-thirds of all households, although ownership had slowly edged upward. The most dramatic change occurred between 1961 and 1991. During this period, home ownership increased sharply, rising from around 40% in 1961 to a peak of approximately 70% in 2001. During the same period, renting fell to just about 30%, marking a complete reversal of the 1918 situation. The year 1971 was a key turning point, as the proportion of owners and renters became equal for the first time, both standing at around 50%. Although ownership remained dominant into the 21st century, the final decade saw a slight decline. By 2011, home ownership had fallen back to around 65%, while renting rose modestly to just over one-third of all households.
文章身份
机构教研范文
题目来源
教学题目
句子漫游 · 我的账户

欢迎回来

注册后可主动领取 3–7 天新手券。

选择适合你的练习节奏

练习时长

AI 学习需有可用练习时长。