
四国每千辆车的盗窃案Thefts per thousand vehicles in four countries
AI 估评 8 分查看四维评分详情
四个维度等权计分,均值 7.75,按半分档展示。AI 估评供学习参考。
任务完成度 TA7 / 9
四国和主要差异清楚,起止值基本准确;瑞典8升14却概述为超过翻倍,英国第二个同高峰未突出,瑞典后期平台被简化。
档位依据:主要趋势及数据支持7档;倍率错误与重要平台省略阻止8档。
查看评分证据
with the number of thefts more than doubling by the end of the decade
瑞典8至14约增75%,未翻倍。
The rate climbed steadily and reached approximately 14 per thousand by 1999.
末值正确,但1996至1998三年平台未体现。
- 题图证据
已查看折线:英国17起、1993和1997达20、1994及1999为16;瑞典8起、1991为7、1996至1998为12、1999为14;法加始终约5至7。
改进建议
- 改为增约四分之三,并补英国1997第二高峰和瑞典后期平台。
连贯与衔接 CC8 / 9
按高位国家和低位国家分组,概述与细节顺序清楚,时间与比较关系易跟随。
档位依据:良好组织符合8档;Besides引入瑞典的连接略泛,尚非9档完全自然。
查看评分证据
Besides, Sweden, which started at a relatively low figure of car theft
转国可跟随,但Besides不如对照标记精确。
By comparison, France and Canada saw much smaller changes
准确提示低波动组。
改进建议
- 用相对英国的趋势对比自然引入瑞典,减少泛化连接。
词汇资源 LR8 / 9
consistently、fluctuated marginally、peak等趋势词流畅,单位使用稳定;figure of car theft略不自然。
档位依据:范围和精度总体达到8档;少量搭配松散限制9档。
查看评分证据
relatively low and stable figures of vehicle theft
水平和稳定性表达清楚。
a relatively low figure of car theft
以a lower theft rate表达更自然。
改进建议
- 用theft rate统一指标,严格区分doubling与百分比增长。
语法范围与准确性 GRA8 / 9
关系从句、让步、分词及比较结构准确,多数句子无误,时态控制稳定。
档位依据:结构范围和准确性支持8档;瑞典句插入较长,未达到9档完全自如。
查看评分证据
which was already much higher than in the other three nations
关系与比较结构准确。
although their figures fluctuated marginally over time, they ended the decade at similar levels
让步和主句衔接准确。
改进建议
- 缩短瑞典句的长插入说明,保留起点与终点主线。
评分日期:2026-10-23 · 评分规则:IELTS 写作公开评分标准(2023 年 5 月版)
作文题目
来源页题目,与同页选定答案配套;未核为实际考试真题
The line graph shows thefts per thousand vehicles in four countries between 1990 and 1999.
Summarise the information by selecting and reporting the main features, and make comparisons where relevant.
You should write at least 150 words.
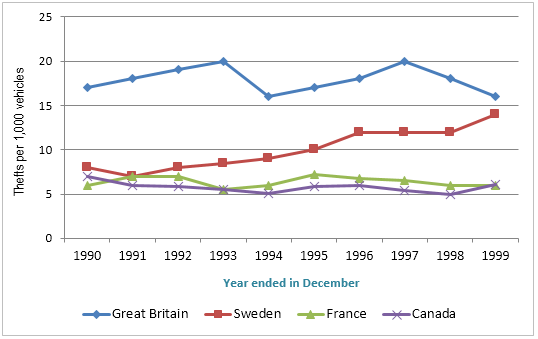
The line graph compares the number of vehicle theft cases per thousand in Great Britain, Sweden, France and Canada over a ten-year period, starting from 1990.
In general, Great Britain consistently had the highest rate of car thefts throughout the period, while France and Canada experienced relatively low and stable figures of vehicle theft. In contrast, Sweden showed a clear upward trend, with the number of thefts more than doubling by the end of the decade.
In 1990, the rate of car thefts in Great Britain was almost 17 per thousand vehicles, which was already much higher than in the other three nations. After rising to a peak of about 20 per thousand in 1993, it then fluctuated slightly but remained at a high level, ending the period close to 16 per thousand in 1999. Besides, Sweden, which started at a relatively low figure of car theft, roughly 8 thefts per thousand vehicles in 1990, experienced a significant increase over a decade. The rate climbed steadily and reached approximately 14 per thousand by 1999.
By comparison, France and Canada saw much smaller changes in recorded vehicle theft cases. In 1990, both countries recorded theft rates between 5 and 7 per thousand vehicles, and although their figures fluctuated marginally over time, they ended the decade at similar levels of around 6 per thousand.
- 文章身份
- 机构教研范文
- 题目来源
- 教学题目