范文阅读导入练习 →

英格兰和威尔士人口出生率及死亡率Population size, birth and death rates of England and Wales

Task 1 · Academic数据时序变化概括家庭与社会238 词AI 估评 7 分
AI 估评 7 分查看四维评分详情

四个维度等权计分,均值 7,按半分档展示。AI 估评供学习参考。

任务完成度 TA6 / 9

人口增长和末段出生反弹、死亡稳定抓取正确,但概述称出生率长期下降与首尾30至34不符;略过两段明显平台,用exponential夸大人口增长形式,末句又作未被图证实的因果推断。

档位依据:覆盖所有序列且有概述达到6档;关键趋势不够准确,不能达到7档清晰准确呈现主要特征。

查看评分证据
  • a long-term decline in both birth and death rates

    出生率期末高于期初,概述不准确。

  • underpinned by rising fertility and low mortality rates

    图只呈现同时变化,不能据此充分判定人口增长原因。

  • 题图证据

    已看双轴折线:人口百万约2.5/10/3.5/10/25/45/50(1700起每50年);出生每千人30/40/40/33/32/22/34;死亡26/37/37/27/27/20/20。出生期末高于期初,1950后反弹;死亡末段稳定。

改进建议

  • 概述出生率先升、后降、再回升;交代平台并删去末句因果判断。

连贯与衔接 CC7 / 9

人口与比率分段明确,先概述再按时间展开,推进清楚;末尾再泛化人口繁荣而未增加必要信息,段内平台衔接略粗。

档位依据:清晰组织达到7档;冗余收束和过度概括限制8档。

查看评分证据
  • At the beginning of the 18th century

    人口段起点清楚。

  • In terms of demographic rates in England and Wales

    转入两类比率明确,但重复地点可删。

改进建议

  • 压缩结尾,利用篇幅按平台和转折分组比较。

词汇资源 LR7 / 9

rebounded、stabilised、mortality等词汇有范围;exponential是严格增长形式术语,用于此图不精确,最后demographic shift in搭配不自然。

档位依据:词汇范围足够支持7档;少量用词夸张或搭配失当限制8档。

查看评分证据
  • From then on, growth was exponential

    后期增长明显放缓,exponential不合适。

  • a profound demographic shift in a sustained population boom

    抽象名词组合不够自然。

改进建议

  • 改为population rose sharply after 1800,再说明1950后增速放缓。

语法范围与准确性 GRA8 / 9

复杂句、before分词结构、whereas对照及被动分词补充基本准确,主谓与时态稳定。

档位依据:多种结构且多数句无误达到8档;有些长句可缩短,未充分达到9档简洁自如。

查看评分证据
  • before embarking on a steep upward trajectory

    时间分词结构正确。

  • while the death rate remained relatively constant at around 20

    对照从句结构准确。

改进建议

  • 删去修辞性结尾长句,保留现有清楚的趋势对照句。

评分日期:2026-10-23 · 评分规则:IELTS 写作公开评分标准(2023 年 5 月版)

作文题目

来源页题目,与同页选定答案配套;未核为实际考试真题
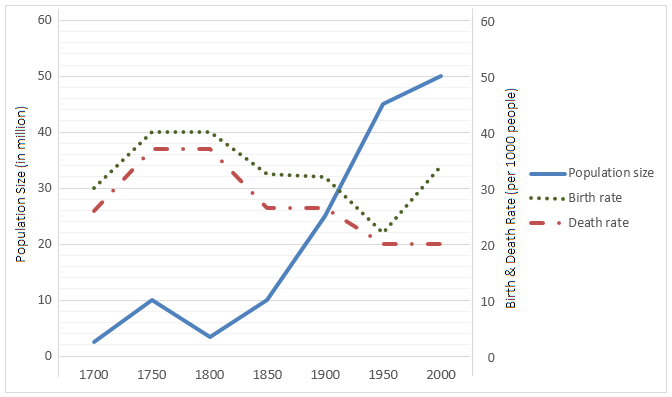
The line graph below shows the population size, birth and death rates of England and Wales from 1700 to 2000. Summarise the information by selecting and reporting the main features and make comparisons where relevant. You should write at least 150 words.
题目配图:IELTS Graph # 306 – Population size, birth and death rates of England and Wales
来源题图 · 查看来源
The line graph illustrates the population size, and the birth and death rates per 1,000 people in England and Wales between 1700 and 2000. As is obvious, over the three centuries, there was a dramatic increase in population alongside a long-term decline in both birth and death rates. Notably, after about 1950, the birth rate rebounded, whereas the death rate stabilised at a relatively low level. At the beginning of the 18th century, the population in England and Wales was very small, around 2.5 million, and it rose to approximately 10 million by 1750. However, by 1800 it fell back to near its original size, before embarking on a steep upward trajectory. From then on, growth was exponential, and by the year 2000, the population had reached around 50 million. In terms of demographic rates in England and Wales, the birth rate began at about 30 per 1,000 people in 1700 and climbed to roughly 40 by 1750. The death rate followed a similar upward trend during this first half-century, nearing 38 per 1,000. After 1750, both rates declined gradually, reaching just over 20 by around 1950. From 1950 to 2000, the birth rate rose again, reaching about 34 per 1,000, while the death rate remained relatively constant at around 20. Therefore, England and Wales experienced a profound demographic shift in a sustained population boom, underpinned by rising fertility and low mortality rates.
文章身份
机构教研范文
题目来源
教学题目
句子漫游 · 我的账户

欢迎回来

注册后可主动领取 3–7 天新手券。

选择适合你的练习节奏

练习时长

AI 学习需有可用练习时长。