
公交与铁路年度客流Annual bus and rail journeys
作文题目
页面明确说明题目与报告均为网站原创,不是回忆或转载真题。
The task. The graph below shows the number of journeys made per year by bus and by rail in one European country between 1995 and 2020. Summarise the information by selecting and reporting the main features, and make comparisons where relevant.
Year | Bus journeys (millions) | Rail journeys (millions)
1995 | 45 | 20
2000 | 48 | 24
2005 | 44 | 30
2010 | 38 | 34
2015 | 33 | 39
2020 | 30 | 41
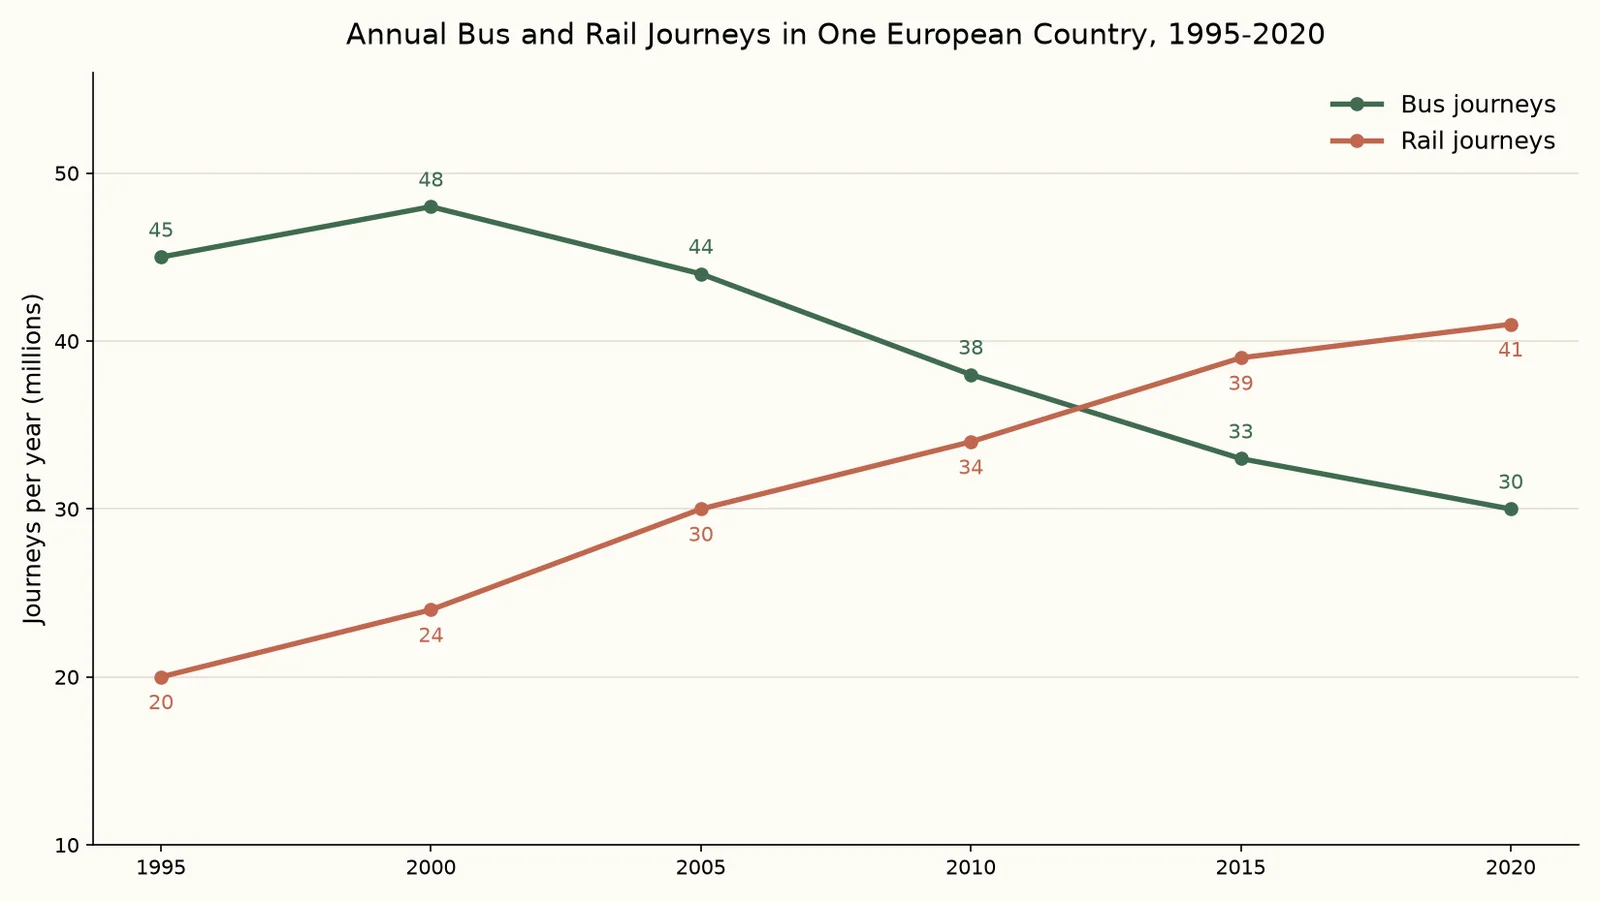
The line graph compares annual bus and rail passenger journeys in one European country between 1995 and 2020.
Overall, rail travel rose throughout the period while bus use, after a small early gain, fell steadily; by 2015 rail had overtaken buses, which had begun the period far ahead.
In 1995 buses carried 45 million passengers, more than double the figure for rail, at 20 million. Bus journeys then edged up to a peak of 48 million in 2000 before slipping in every subsequent five-year period, most sharply between 2005 and 2010, and they ended the period at 30 million.
Rail followed the reverse path, rising in each interval to 41 million journeys by 2020, more than double its starting point. The strongest growth came between 2000 and 2005, when the figure rose by 6 million, while the final five years brought the smallest increase, of just 2 million. The result was a complete reversal: rail, at 41 million journeys, finished 11 million ahead of the bus, having trailed it by 25 million at the start.
- 文章身份
- 机构教研范文
- 题目来源
- 原创教学练习题