
博物馆访客数量变化Museum visitors over time
AI 估评 8.5 分待复核查看四维评分详情
四个维度等权计分,均值 8.5,按半分档展示。AI 估评供学习参考。
任务完成度 TA9 / 9
概述两馆上升、一馆下降与第一名更替;逐项报告关键数值,并准确突出艺术馆前五年翻倍、后五年仅微升。主要要求完整满足。
档位依据:主要特征选择与数字均准确,未见影响内容的遗漏;达到9档近乎完整恰当的呈现。
查看评分证据
the History Museum replaced the Science Museum as the most visited of the three
2010年科学馆55万高于历史馆40万;2015年历史馆52万超科学馆50万。
its visitor numbers doubled from 150,000 to 300,000 in the first five years, before growing only slightly to 320,000 by 2020
艺术馆两段增幅及数据均准确。
- 题图证据
来源数据表列三馆三年完整数据,历史馆400,000/520,000/650,000,科学馆550,000/500,000/430,000,艺术馆150,000/300,000/320,000。
- 题图证据
该图明确标为根据来源数据重绘、非原题图;三条折线所标数据与来源表一致。
改进建议
- 保持数字与比较的对应;若展示题图须持续标明折线图为重绘。
连贯与衔接 CC9 / 9
引言与总览之后,把走势相反的两馆合并比较,再单列艺术馆的两阶段增长;代词和转折自然,读者可毫不费力地跟随。
档位依据:段落功能、信息顺序和衔接均娴熟,未见显著停顿,符合9档。
查看评分证据
Over the following decade these two moved in opposite directions.
these two清楚回指前句的科学馆与历史馆,并引出对照。
Despite this increase, it remained the least visited museum at the end of the period.
让步句回扣艺术馆始终最低的总体比较。
改进建议
- 维持按主要趋势成组比较的组织方式。
词汇资源 LR8 / 9
visitor numbers、attendance、attracted、overtaken等变化和排名词准确,足以自然呈现数量关系;语料短,词汇虽灵活但不需上调到9档。
档位依据:广泛且恰当的任务词汇达到8档;未充分显示9档全范围高度精确的词汇控制。
查看评分证据
Attendance at the History Museum climbed steadily to 650,000
attendance与climbed自然表述游客量增长。
the History Museum had overtaken it by 2015
overtaken精确表达排名转换。
改进建议
- 继续用具体数量词和比较动词表达变化。
语法范围与准确性 GRA8 / 9
时间、对照、让步和完成时结构准确,绝大多数句子无误;可见结构范围与控制均强。
档位依据:灵活准确使用多种结构达到8档;短篇样本未充分证明9档完全自如的结构范围。
查看评分证据
while the figure for the Science Museum declined to 430,000
while从句准确形成方向对照。
before growing only slightly to 320,000 by 2020
时间顺序及分词结构清楚。
改进建议
- 保留这种清晰的时间对照句式。
评分日期:2026-10-23 · 评分规则:IELTS 写作公开评分标准(2023 年 5 月版)
作文题目
页面明示为原创练习题;非实考题
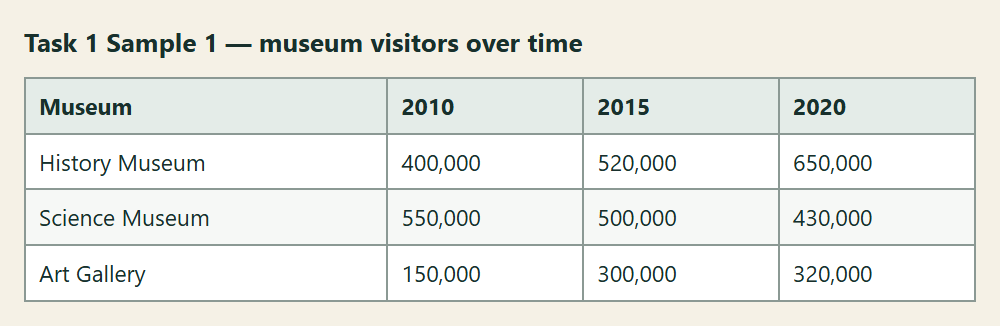
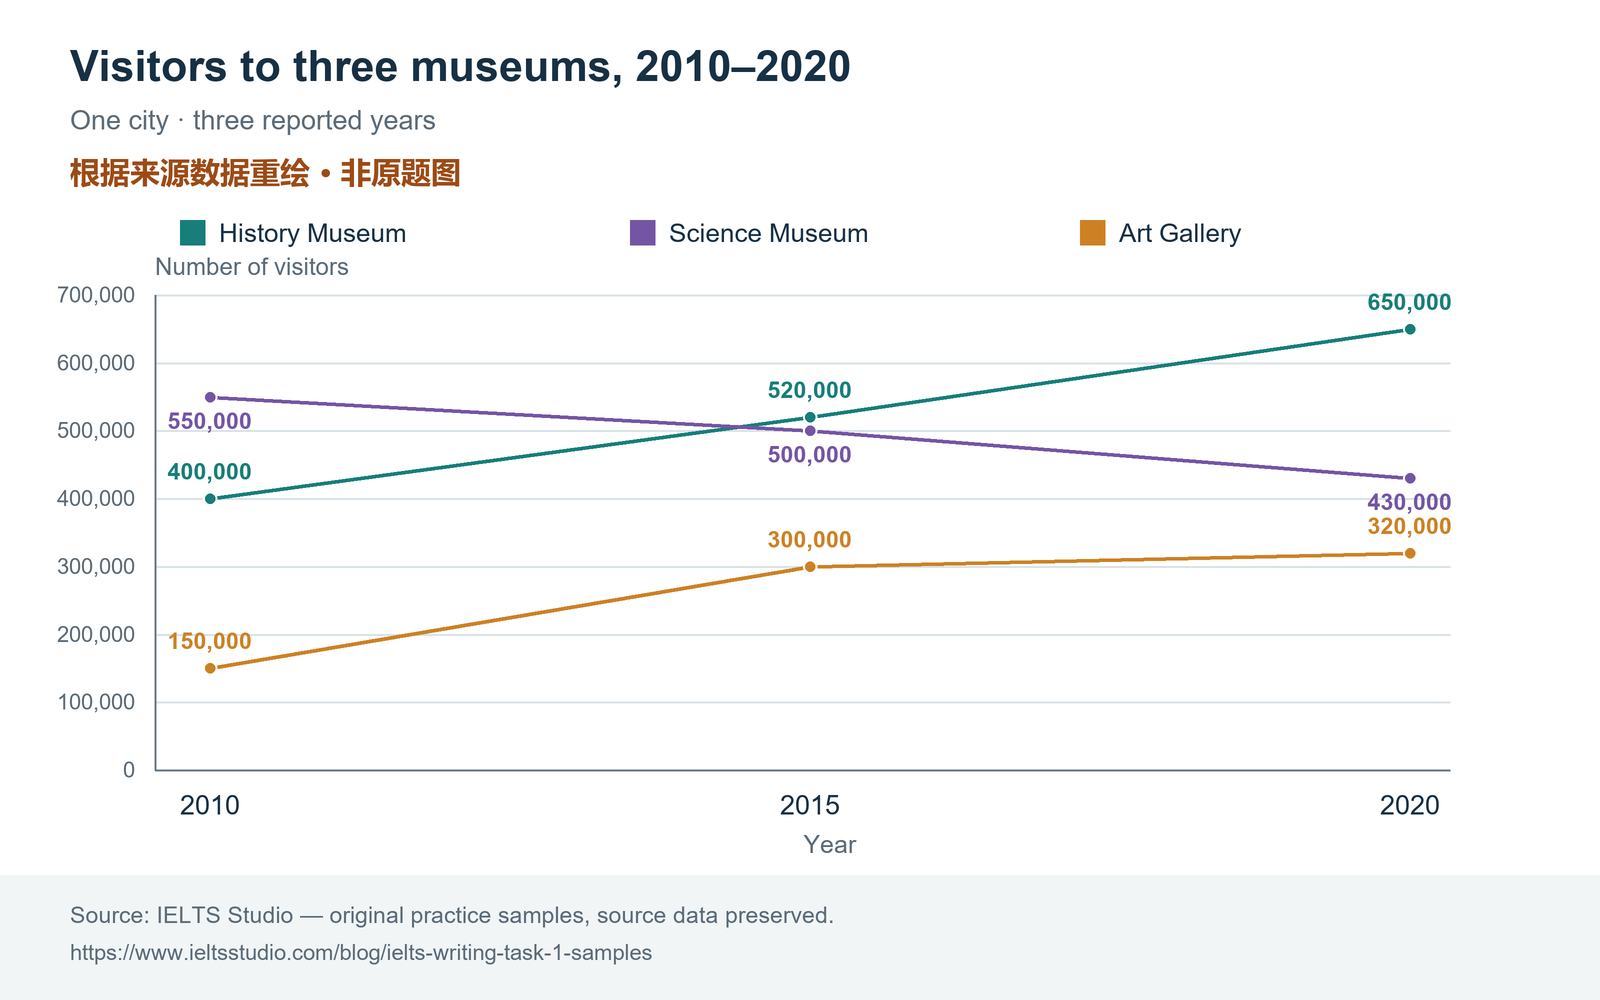
题目材料说明:来源实际提供数据表;折线图按同一数值重绘,原题图形形式待核。
- 文章身份
- 机构教研范文
- 题目来源
- 原创教学练习题