
纽约人口在1800至2000年的变化Changes in the population of New York City from 1800 to 2000
AI 估评 7.5 分查看四维评分详情
四个维度等权计分,均值 7.25,按半分档展示。AI 估评供学习参考。
任务完成度 TA7 / 9
总体增长和人口重心迁移清楚,主要数字覆盖充分;但76%称稍多于三分之二偏低,647万称远高于640万夸大差距,1800其余区18701直接写18000也不够准确。
档位依据:主要特征和清楚概述支持7档;数值概括的精度不足以达到8档。
查看评分证据
representing slightly more than two-thirds of the total population
实际76%,更接近四分之三。
surged to much higher than 6.4 million
实际6471089,仅略高于640万。
- 题图证据
已查看三表:总人口79216、3437202、8009185;曼哈顿60515/76%、1850093/54%、1538096/19%;其余四区18701/24%、1587109/46%、6471089/81%。
改进建议
- 以约四分之三描述76%,末期四区合计写约647万。
连贯与衔接 CC7 / 9
先全市总量后区际分布,时间推进清楚;population distribution和By年份反复使用,末段过长,概述比较对象稍含混。
档位依据:逻辑组织符合7档;重复和长段负担尚未达到8档流畅管理。
查看评分证据
the population distribution in Manhattan in 1800 and 1900 was much higher
比较对象未明确写出。
A closer look at the population distribution in five districts of this city reveals a clear shift.
细节分组清楚,但与概述重复较多。
改进建议
- 明确曼哈顿份额高于其余区合计,并把其份额变化和绝对人口变化分清。
词汇资源 LR7 / 9
accounted for、share、surged等用词充分;population distribution was higher和much higher than不够精确,部分表达冗长。
档位依据:可灵活表达主要含义,符合7档;搭配及程度词的精度限制8档。
查看评分证据
with the other four districts accounting for an increasingly large proportion of residents
份额表达自然。
the population distribution in Manhattan in 1800 and 1900 was much higher
distribution不宜直接用higher描述。
改进建议
- 用Manhattan’s share was larger明确比较量,并校准slightly、much等程度词。
语法范围与准确性 GRA8 / 9
时间状语、让步从句、分词结构与并列句控制准确,绝大多数句子无明显语法错误。
档位依据:复杂句准确性支持8档;部分多层修饰较长,灵活性尚非9档的完全自如。
查看评分证据
although Manhattan’s population grew significantly to more than 1.8 million, its share of the total population declined to 54%
让步关系和时态准确。
reducing its share to just 19% of the total
分词结构准确承接人口下降。
改进建议
- 压缩概述中的多层并列修饰,使比较对象更易辨认。
评分日期:2026-10-23 · 评分规则:IELTS 写作公开评分标准(2023 年 5 月版)
作文题目
来源页题目,与同页选定答案配套;未核为实际考试真题
The first table below shows changes in the total population of New York City from 1800 to 2000. The second and third tables show changes in the population of the five districts of the city (Manhattan, Brooklyn, Bronx, Queens, Staten Island) over the same period.
Summarise the information by selecting and reporting the main features, and make comparisons where relevant.
Write at least 150 words.
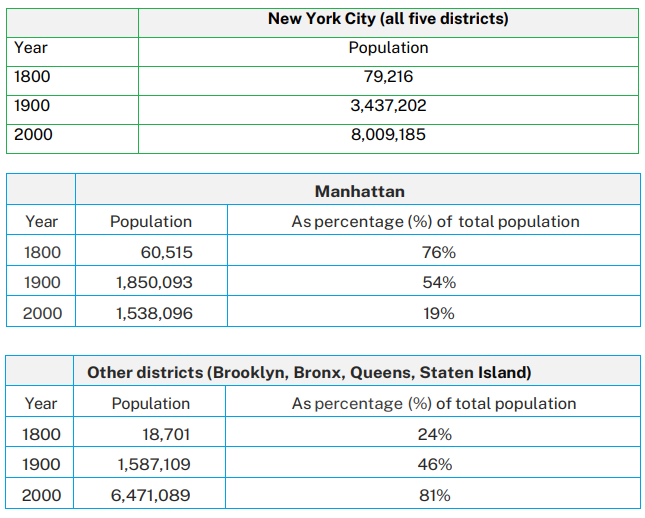
The tables provide information about the total population of New York City in 1800, 1900 and 2000, as well as the population distribution between Manhattan and the other four districts over the same period.
Overall, the population in New York City dramatically increased over the two centuries. At the same time, the population distribution in Manhattan in 1800 and 1900 was much higher, but became far less concentrated in 2000, with the other four districts accounting for an increasingly large proportion of residents by 2000.
In 1800, the total population of New York City was relatively small, at around 80 thousand. By 1900, this number rose sharply to nearly 3.5 million, and it more than doubled again to reach over 8 million in 2000.
A closer look at the population distribution in five districts of this city reveals a clear shift. In 1800, Manhattan’s population was more than 60 thousand, representing slightly more than two-thirds of the total population. The other districts combined accounted for only 18,000 residents or just 24%. By 1900, although Manhattan’s population grew significantly to more than 1.8 million, its share of the total population declined to 54%, while the other four districts’ share of the population increased to 46%. By 2000, Manhattan’s population had declined slightly to 1.5 million, reducing its share to just 19% of the total. In contrast, the combined population of Brooklyn, the Bronx, Queens and Staten Island surged to much higher than 6.4 million, accounting for a dominant 81%.
- 文章身份
- 机构教研范文
- 题目来源
- 教学题目