
欧洲城市居民的上下班交通方式How people in a European city reached their office and got back home
AI 估评 7.5 分查看四维评分详情
四个维度等权计分,均值 7.25,按半分档展示。AI 估评供学习参考。
任务完成度 TA7 / 9
方式主导转变及距离时长覆盖准确;汽车25% increase和公交2%混淆百分点,交通改善的因果没有图据,faster需明确为推算平均速度而非用时更短。
档位依据:主要特征和数字支持7档;差值口径及原因推断限制8档。
查看评分证据
a 25% increase
10%至35%是25个百分点,非增长25%。
faster due to improvements in transport
图可支持平均速度推算,不能证明改善是原因。
- 题图证据
已看两饼图及数据:1959步55、公交15、火车15、车10、其他5%;2009步25、公交13、火车15、车35、其他12%;距离3.5/19km,时长17/42分钟。
改进建议
- 用percentage points表份额差,删去因果解释,明确旅程更长且耗时增加。
连贯与衔接 CC7 / 9
先方式后距离时间分段清楚;结尾faster重复概述并与increased duration容易造成表面冲突,指向需更明确。
档位依据:整体清楚符合7档;概念连接不够精确限制8档。
查看评分证据
Moreover, people in this European city travelled for 17 minutes on average, which also increased to 42 minutes.
also承接增长,但which指时间需读者补足。
Despite this increase, their commute got faster
需明确指速度,避免误解为耗时变短。
改进建议
- 将距离和耗时并列,若提速度需明确计算口径。
词汇资源 LR7 / 9
commuted、fivefold、surged等词有效;Train usage ratio和rate混用,commute got faster较模糊。
档位依据:词汇有变化支持7档;指标搭配不够准确自然限制8档。
查看评分证据
Train usage ratio remained unchanged
用the share travelling by train更自然。
the average commuting distance increased about fivefold
倍数表达自然且近似合理。
改进建议
- 统一share of commuters,区分journey duration和average speed。
语法范围与准确性 GRA8 / 9
关系、比较、分词及让步结构基本准确,复杂句控制较稳。
档位依据:广泛结构和多数无误句达到8档;which的修饰对象略松,未达9档。
查看评分证据
with journeys becoming much longer and faster
with复合结构正确。
which also increased to 42 minutes
语法可读但先行词不明确为平均时长。
改进建议
- 以the average duration为明确主语,减少松散which指代。
评分日期:2026-10-23 · 评分规则:IELTS 写作公开评分标准(2023 年 5 月版)
作文题目
来源页题目,与同页选定答案配套;未核为实际考试真题
The graphs below show how people in a European city reached their office and got back home in 1959 and 2009.
Summarise the information by selecting and reporting the main features, and make comparisons where relevant.
You should write at least 150 words.
Journeys to and from work
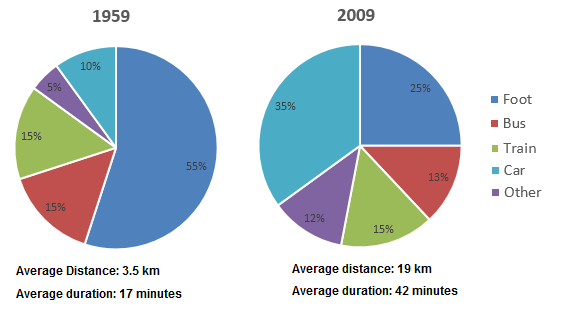
The pie charts depict how people in a European city commuted to their offices in 1959 versus 2009, and also show the average journey distance and time in those years.
Overall, there was a dramatic shift from walking to commuting by car over the 50-year span. Furthermore, the average commuting distance increased about fivefold, with journeys becoming much longer and faster due to improvements in transport.
In 1959, more than half of commuters (55%) walked, while only one-tenth of them used a car. Buses and trains each accounted for 15%, and “other” modes made up 5% of the commutes that they made. By 2009, the proportion of people who walked to their offices dropped sharply – only a quarter of the total, but the percentage of car users surged to 35% – a 25% increase. Train usage ratio remained unchanged, but bus travel witnessed a slight drop (by 2%), while other transport modes more than doubled to 12%.
It is worth noting that the average length of commuting trips increased from approximately 3.5 km in 1959 to 19 km in 2009. Moreover, people in this European city travelled for 17 minutes on average, which also increased to 42 minutes. Despite this increase, their commute got faster as they travelled a far greater distance on average.
- 文章身份
- 机构教研范文
- 题目来源
- 教学题目