
四国的国内生产总值GDP in four countries in billions of US dollar
AI 估评 7.5 分查看四维评分详情
四个维度等权计分,均值 7.5,按半分档展示。AI 估评供学习参考。
任务完成度 TA7 / 9
最高最低、马来西亚峰后回落及其余增长准确,主体端点有支持;尼泊尔起终点估计偏低,孟加拉增速更快未说明按相对比例而非绝对增量。
档位依据:有清晰概述与主要特征达到7档;数值精确性和比较口径限制8档。
查看评分证据
Bangladesh’s GDP rising at a slightly faster pace than Pakistan’s
应明确是相对增幅,绝对增量并不更大。
starting at roughly $10 billion in 2010 and ending at around $15 billion in 2015
图中尼泊尔更接近15及20十亿美元,估值偏低。
- 题图证据
已看四折线:马来西亚约255升至2014年340后2015年约300;巴基斯坦约180升270;孟加拉约115升195;尼泊尔约15升20,整体接近平稳,纵轴每100为大刻度。
改进建议
- 尼泊尔改为约150亿到200亿美元,并用proportionally more明确孟加拉相对增幅。
连贯与衔接 CC8 / 9
概述后依次介绍三国,再单列平缓的尼泊尔,趋势和终点连接自然;开头解释经济指标略占篇幅。
档位依据:良好组织和清晰对照达到8档;压缩背景解释可更接近9档精练。
查看评分证据
until it peaked at about $340 billion in 2014 before dipping
峰值与反转一气衔接。
By contrast, Nepal’s GDP remained relatively flat
用最低且平缓的一国形成明确对照。
改进建议
- 删去国内生产总值作为经济指标的定义,将篇幅留给数据比较。
词汇资源 LR7 / 9
peaked、dipping、marginal increases和relatively flat合适,趋势词丰富;GDP及growth多次重复,slightly faster pace的比较维度不够精确。
档位依据:范围足够且用词基本准确符合7档;重复与宽泛比较限制8档。
查看评分证据
saw a gradual increase each year
增长措辞清楚。
with only marginal increases
准确表达尼泊尔变化较小。
改进建议
- 可交替用output、the figure,并写a larger proportional rise。
语法范围与准确性 GRA8 / 9
关系从句、while对照、分词起终点说明和until/before结构准确,标点基本清楚,绝大多数句无误。
档位依据:丰富结构与准确性达到8档;引言namely两侧逗号较繁,未充分达9档自然精练。
查看评分证据
The GDP, which is an economic indicator for a country, has been measured
关系从句及完成被动结构正确,虽内容可压缩。
starting at roughly $10 billion in 2010 and ending at around $15 billion in 2015
两个分词短语平行正确。
改进建议
- 把引言简化为compares GDP in...,减少不必要插入结构。
评分日期:2026-10-23 · 评分规则:IELTS 写作公开评分标准(2023 年 5 月版)
作文题目
来源页题目,与同页选定答案配套;未核为实际考试真题
The line graph below compares the Gross Domestic Product (GDP) in four countries in billions of US dollar.
Write a report for a university lecturer and report the main features, and make comparisons where relevant.
You should write at least 150 words.
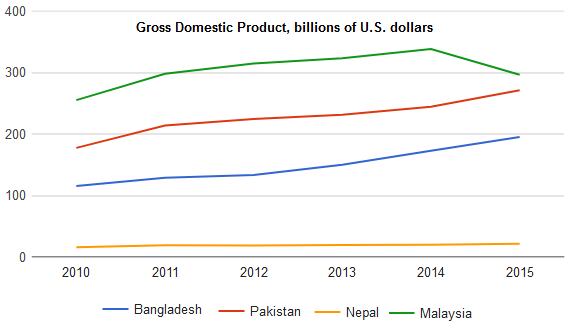
The line graph compares the Gross Domestic Product (GDP) of four developing countries, namely, Bangladesh, Pakistan, Nepal and Malaysia, over six years from 2010 to 2015. The GDP, which is an economic indicator for a country, has been measured in billions of US dollars in the chart.
Overall, Malaysia consistently led in GDP throughout the period, while Nepal had the lowest GDP and showed very little change. Both Pakistan and Bangladesh experienced steady economic growth, with Bangladesh’s GDP rising at a slightly faster pace than Pakistan’s.
In 2010, Malaysia’s GDP was already the highest among the four given countries at roughly $260 billion, and it continued to expand until it peaked at about $340 billion in 2014 before dipping to $300 billion in 2015. Pakistan began the period at around $180 billion and saw a gradual increase each year, reaching approximately $275 billion by 2015. Bangladesh’s GDP also grew consistently, rising from about $110 billion in 2010 to nearly $200 billion in 2015.
By contrast, Nepal’s GDP remained relatively flat across the six years, starting at roughly $10 billion in 2010 and ending at around $15 billion in 2015, with only marginal increases.
- 文章身份
- 机构教研范文
- 题目来源
- 教学题目