
2000与2020年家庭支出Household spending in 2000 and 2020
AI 估评 8.5 分待复核查看四维评分详情
四个维度等权计分,均值 8.5,按半分档展示。AI 估评供学习参考。
任务完成度 TA9 / 9
准确概述住房与食品最大项逆转、休闲上升、食品和其他下降;五类变化、交通最稳定、2020年最小项全部有正确数据支撑。
档位依据:任务要求完整恰当满足,几乎无内容疏漏,达到9档。
查看评分证据
housing took up a growing share of spending and replaced food as the largest category
2000年食品30%高于住房28%,2020年住房36%高于食品22%。
Transport was the most stable category, rising by only one percentage point to 15%.
交通14%升至15%,变化幅度五类中最小。
- 题图证据
来源表显示住房28→36、食品30→22、交通14→15、休闲10→14、其他18→13%。
- 题图证据
两饼图明确标为根据来源数据重绘、非原题图,扇区与表格数值一致。
改进建议
- 保留五类变化与主要排名的精确对应。
连贯与衔接 CC9 / 9
概述后先对比最大两类,再合并其余三类;this order、among the smaller categories、remaining spending等承接自然,信息推进无需回看。
档位依据:分类、段落及衔接均娴熟,符合9档。
查看评分证据
Twenty years later this order had been reversed.
this order紧扣上一句食品与住房的排名。
Among the smaller categories, the share spent on leisure increased from a tenth to 14%.
自然从两大类过渡到其余类别。
改进建议
- 继续按变化的重要性分组。
词汇资源 LR8 / 9
took up、just ahead、reversed、a tenth、just over a fifth等表达自然且精确,足以灵活传达比例;未见明显错误。
档位依据:词汇宽而准确达到8档;样本较短,9档的全范围高级控制尚未充分显示。
查看评分证据
just ahead of housing at 28%
准确传达食品30%仅略高于住房28%。
food had dropped to 22%, or just over a fifth
对百分比作自然准确的分数改述。
改进建议
- 保持比例词与具体数据的对应。
语法范围与准确性 GRA8 / 9
时间对照、被动、whereas从句和分词结果句均准确,标点清楚;多数句子无误。
档位依据:多种结构灵活准确达到8档;不足以仅凭这篇短文确认9档全程最广范围的完全控制。
查看评分证据
whereas food had dropped to 22%, or just over a fifth
对照从句和过去完成时准确。
making it the smallest category in 2020
结果分词与先行事实关系明确。
改进建议
- 继续用从句和分词明确表达排名变化。
评分日期:2026-10-23 · 评分规则:IELTS 写作公开评分标准(2023 年 5 月版)
作文题目
页面明示原创练习题;非实考题
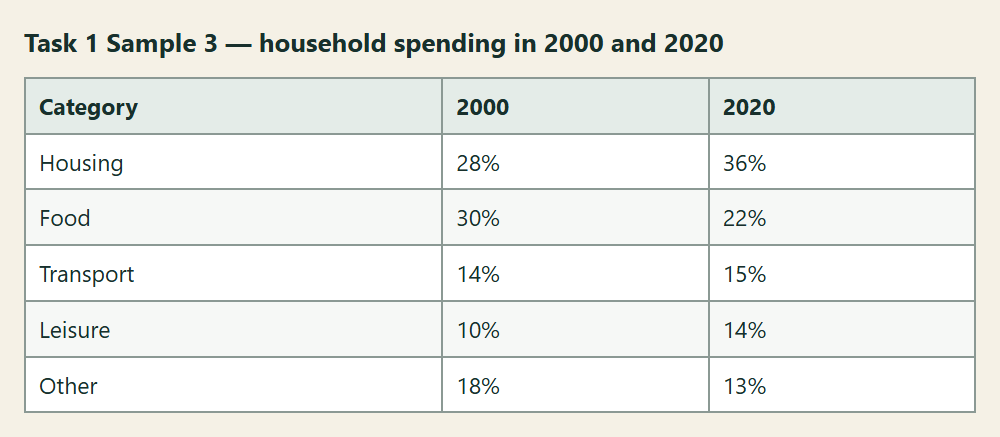
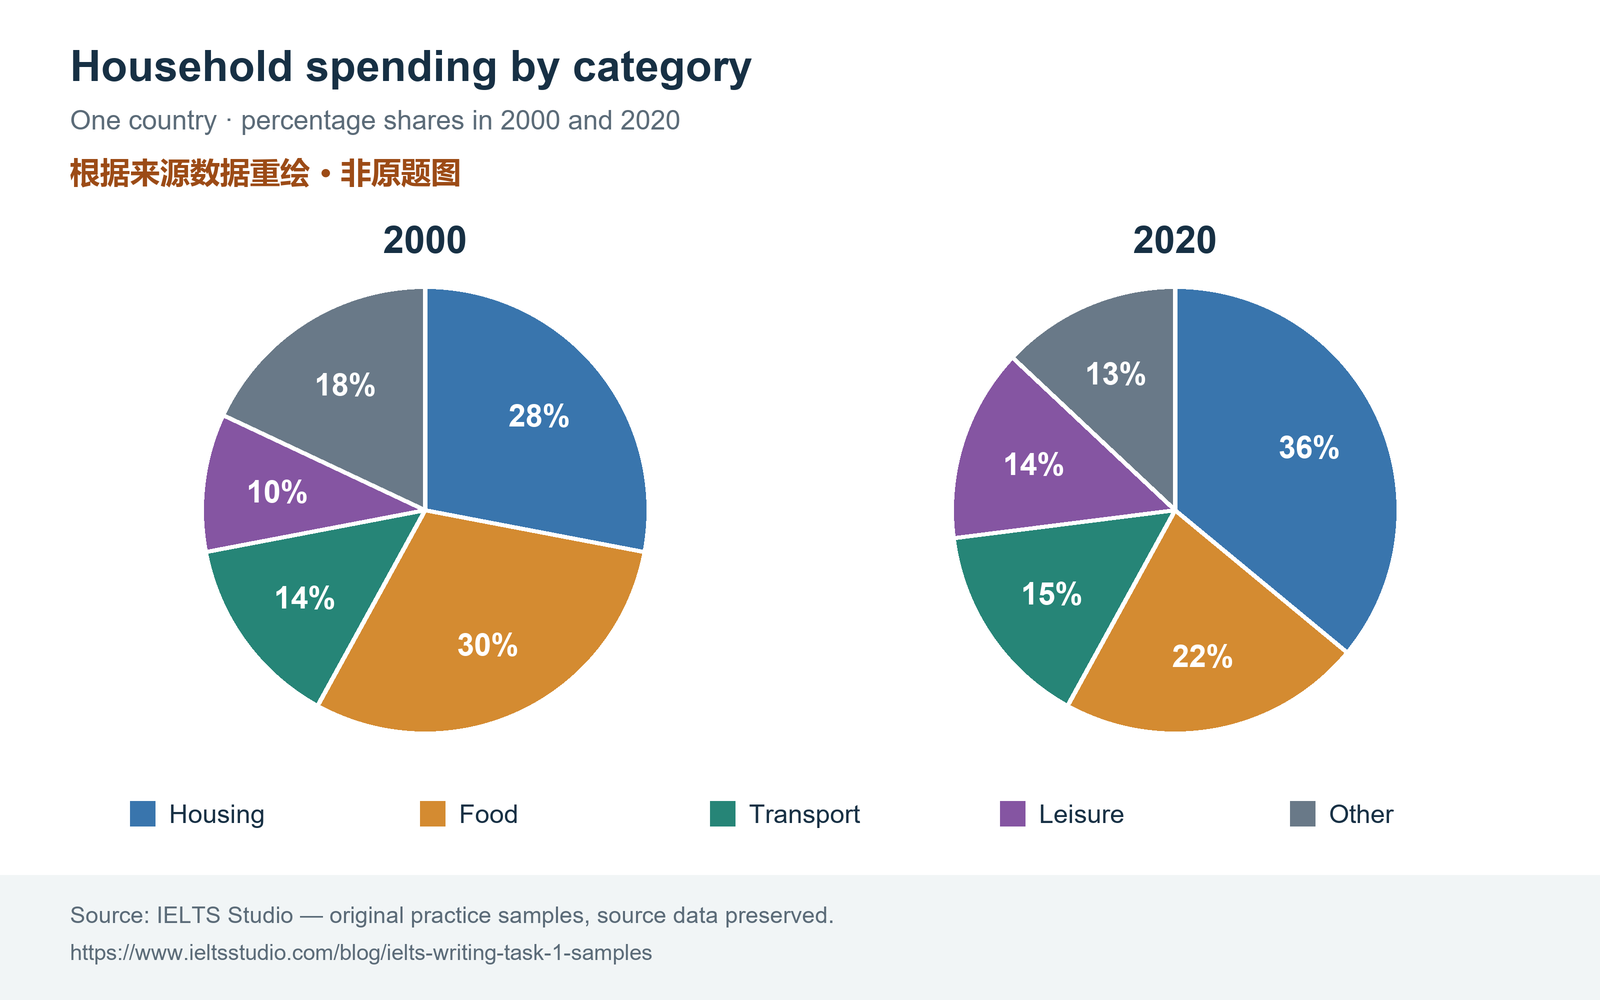
题目材料说明:来源实际提供数据表;饼图按同一数值重绘,原题图形形式待核。
- 文章身份
- 机构教研范文
- 题目来源
- 原创教学练习题